
At the core of a strategy implementation process is the assessment of ideas and project proposals that allows you to choose the most effective projects needed to reach your goal(s). It’s these projects that will make up your strategic portfolio of projects.
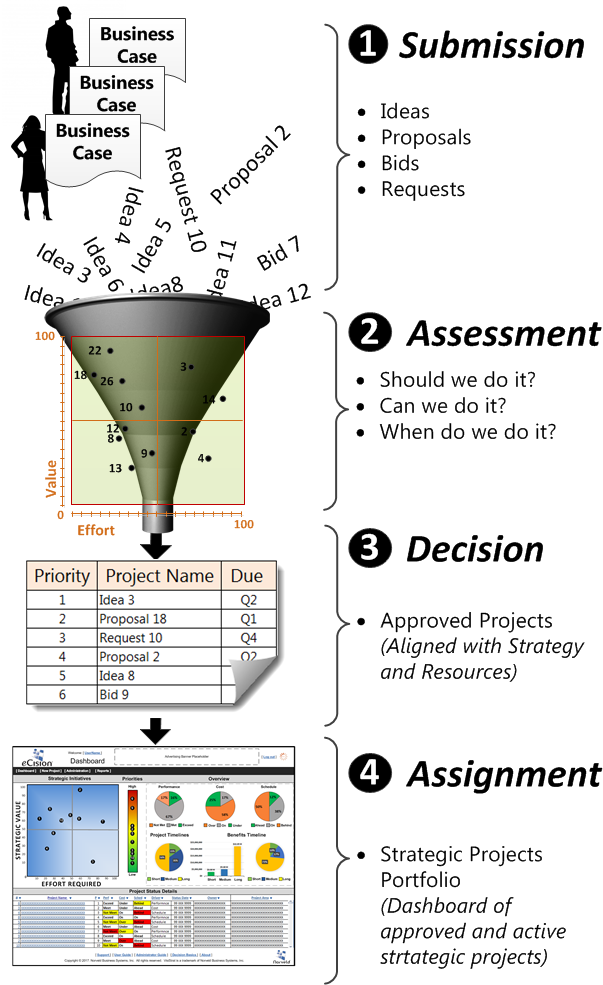
Figure 1: Selection Process
A strategy implementation process applies tools and techniques that help you choose the right things to do. Let’s take a look at how that works.
For years information technology research companies have promoted some form of Cartesian coordinate system to assist us with decision-making. This technique has proven to be quite effective. After scoring an idea or proposal against a specific set of assessment criteria, the resulting math calculates a coordinate to be displayed as a plot point on the chart showing the proposal’s value and required effort. See Figure 2.
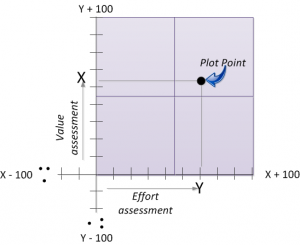
Figure 2: Cartesian coordinate system
This Cartesian based assessment is at the heart of strategy implementation. Conceptually, this step acts as a funnel for ideas and proposals clearly showing what should be done and what should not be done. See Figure 3.

Figure 3: Do and don't do
When your active projects and new proposals are collectively displayed, it’s easy to see what you should be doing and what you should not be doing. Having the tools, process, and culture for strategy implementation will provide the project selection and communication needed to achieve your strategic targets. This process allows you to—
- Build and manage a portfolio of high-value projects and avoid the cost of low-value projects
- Compare consolidated Strategic Value, Effort, Priority, and Financial information on a comprehensive dashboard
- Track each project’s progress against your Performance, Cost and Schedule expectations
Let's look at how to do some of that.
There are two components to the matrix: the questions (referred to as arguments), which is the hard part, and the scoring arithmetic for each argument, which is the easy part.
The matrix used for assessing a project proposal can be simply constructed using a spreadsheet such as MS Excel. However, there is low cost software available that will allow you to create and monitor a strategic portfolio, enter a business case, produce a project charter and provide status updates, maintain history, provide a dashboard for management review, etc. For now, let’s just focus on the assessment piece.
The “Y “axis of the matrix would generally consist of just 5 to 9 arguments that are derived from your strategy framework. The “X” axis would also consist of just 5 to 9 arguments. These would be derived from you’re your organization’s core skills and measures of effort that would be associated with the execution of a project. Answering each argument is done through by selecting one of a few options associated with each argument. Each argument contains a weighting factor and each answer contains a scoring value.
So let’s start with the easy part – the arithmetic.
Let’s assume that we have 5 Value Arguments. See Figure 4.
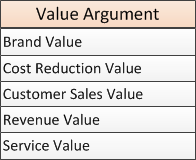
Figure 4: Value Arguments
Now let’s prioritize each argument and apply a weight as shown in figure 5. The weight is a value between 1 and 100 that is assigned to each argument. The total weight applied to all Value Arguments must equal 100.
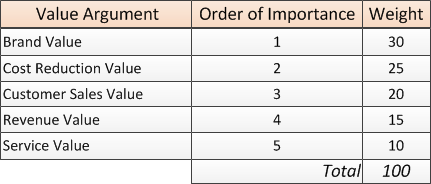
Figure 5; Weights
Now let’s define scoring attributes and apply a score for each. We’ll use the “Cost Reduction Value” as an example. See figure 6.
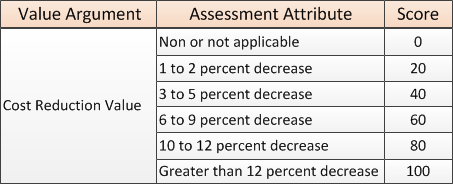
Figure 6: Assessment Attributes
Adding rigor to the scoring process
When developing or selecting the assessment attributes associated with an argument, it is important that the assessment attribute list maintain continuity in both the scoring method and scoring measure.
Scoring Method
The scoring method is a categorization scheme used for developing scoring outcomes. Each Argument’s list of attributes should use only one of three scoring methods:
- Ordered inclusive: All properties of a scoring measure will be passed from its predecessor attribute to its successor.
- Ordered exclusive: Every element in the list contains a defined value. The value will increase as the order of the list progresses. Each list attribute may or may not include the value of some other attribute.
- Exclusive: Every element in the list is exclusive but with each item chosen, the value of the collective attributes increases. For example, three selected items are better than any one or two selected items.
Scoring Measure
The scoring measure is the type of scale used to create value in the scoring method. Each Argument’s list of attributes should use only one of three scoring measures. They are:
- Quantified: A scale can be precisely measured and defined. For example, the scale is measured using percentages or dollar amounts.
- Qualified: a scale that is not precisely measured and defined. For example, the scale is measured using terms such as, moderate or significant.
- Compounded: scale that mixes both qualified and quantified measures. For example, if the scale uses terms such as “significant increase in delivery speed to over 50% of the customer base,”
Putting It All Together
All of the assessment elements are shown in Figure 7 for one value argument.

Figure 7: Putting it Together
Calculating the score for each Value Argument is the selected attribute value score times the weight divided by 10 for example, an increase of 5 to 8% would result in 40*26/10 = 104. Once the project proposal has been scored for all Value Arguments against the strategic plan, the resulting total may be something like 680. This project proposal would then plot on the 680 line of the “Y” axis (Value against the strategic plan.
A similar process is followed for the “X” axis. The resulting total may be something like 380. This project proposal would the plot on the 380 line of the “X” axis (Estimates effort, or level of difficulty, required). The resulting plot point on the matrix would look like figure 8. In this case the project proposal would score in the in a range that seems of reasonable value and not too difficult to pull off.
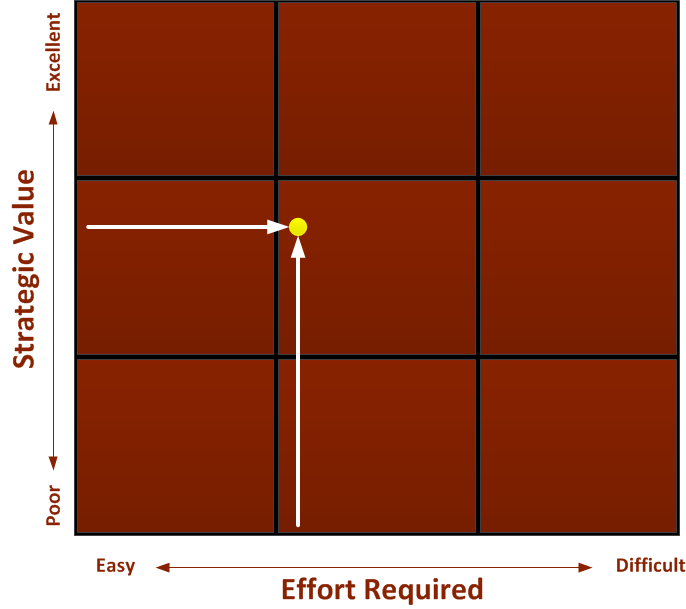
Figure 8: One project plotted
When this proposal is compared to other proposals it can become clear what proposals should be accepted and what should not. It can also show how this proposal stacks up against existing approved projects in the portfolio. See figure “9”.
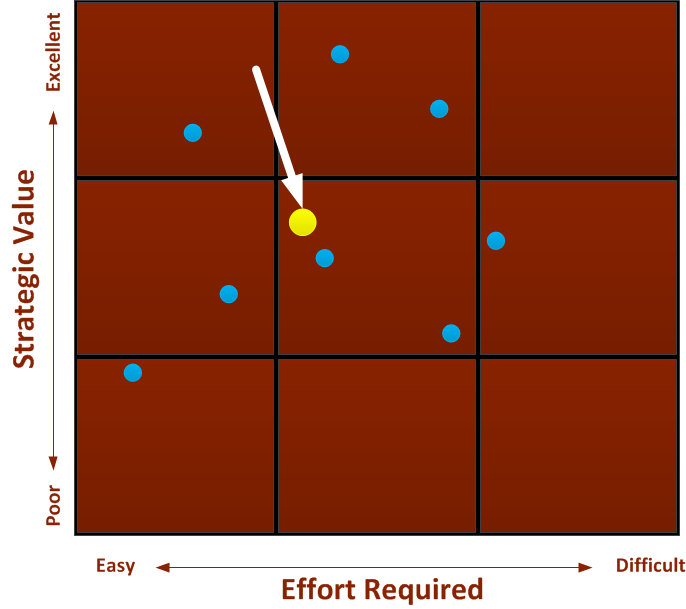
Figure 9: Camparing Projects
You can also create another “X” & “Y” matrix where “X” is risk effect and “Y” is the risk probability.
While this spreadsheet approach can work for one-off’s and selection only, a true strategy implementation application such as Norveld’s eCisionTM can provide you with much more than a simple selection process as well as consulting support for developing Arguments, your strategic framework, and work flows associated with the application.
If you have questions about this process, please feel free to contact me through the contact page on this site and I will get back to you as soon as possible.
